Introduction
In this study we have analysed the NOAA Storm Database in order to determine what are the worst natural catastrophic events, both in terms of public health and in economic impact.
The U.S. National Oceanic and Atmospheric Administration’s (NOAA) storm database tracks characteristics of major storms and weather events in the United States, including when and where they occur, as well as estimates of any fatalities, injuries, and property damage.
The database currently contains data from January 1950 to January 2017, as entered by NOAA’s National Weather Service (NWS).
The database can be found on:
https://www.ncdc.noaa.gov/stormevents/ftp.jsp
RPubs version: http://rpubs.com/erickfis/noaa
GitHub version, with code included and pdf version: https://github.com/erickfis/NOAA-Storm-Database
Objective
The goal of this study is to answer the questions:
Across the United States, which types of events were the most harmful with respect to population health ever recorded in a single occurrence?
Which types of events caused most harm to population health along all those years?
Which types of events had the greatest economic consequences in a single occurrence?
Which types of events had the greatest economic consequences along all those years?
Which were the places that were subject to the greatest losses, both in terms of human health and economic losses.
Methods
To answer each one of those questions, we did a very simple descriptive analysis of data.
We used R tools to filter, sort and combine data, so we could get the total sum of fatalities, injuries and economic losses.
Data Processing
Software and instructions for reproducibility
This study was conducted under the following software:
- R version 3.4.1 (2017-06-30)
- Platform x86_64-pc-linux-gnu
- OS: Linux Mint 18.1 Serena
Using the same versions under the same OS should guaranty reproducibility.
This script downloads the relevant raw data from NOAA repository, under ftp://ftp.ncdc.noaa.gov/pub/data/swdi/stormevents/csvfiles/, and process it.
It is not necessary to keep the files downloaded after running this script because it writes the processed data to the file “data/harm.rda”
Then everytime it is runned, it checks for new data on the ftp server. If there is new data, it will download the files missing and raw process everything again.
Raw data processing
In order to answer our questions, the original database needed to be treated from its raw form to a more useful format.
The necessary transformations were:
- sanitized var names
- evaluated duration of events, however they are not useful
- evaluated damages values according to multipliers provided
- sanitized and grouped similar events: strong snow, heavy snow and light snow all became just “snow”
- sanitized county names
This database has 1436408 observations. Each observation corresponds to an event occurrence.
To determine the most harmful events to human health, we checked the variables related to human health, which are “fatalities” and “injuries”.
To determine the most harmful events to economy, we checked the variables related to economic measures, from “propdmg” through “cropdmgexp”.
Also, in order to analyse various occurrences of the same event, we measured the duration of the event, its magnitude and where the event occurred (state and county name).
This is a really big database whose data has been being registered by a lot of different people since 1950. Thus, as expected, there are variations on how people registered events.
For example, the string “snow” was used to register a lot of events. They are the same type of event, but count as different:
This is why we decided to filter those events: we grouped them by its common strings.
Human health: the most harmfull events
We have determined what events did more harm to human health.
There were occurrences that caused zero fatalities but a lot of injuries. The inverse is also true, so we did a separate analysis to fatal and non-fatal events.
Fatal Occurrences
Most fatal in a single occurrence
Most fatal in a single occurrence
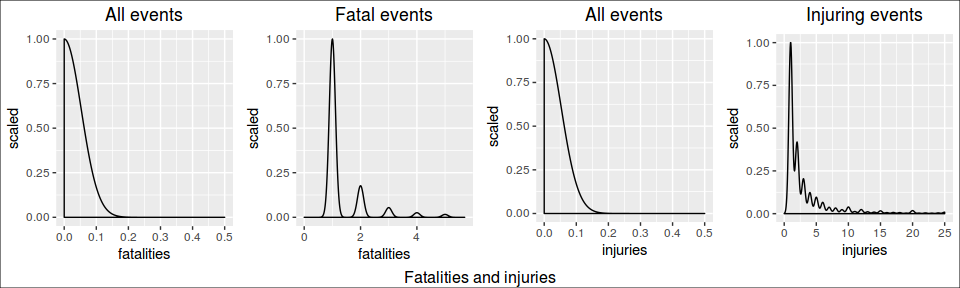
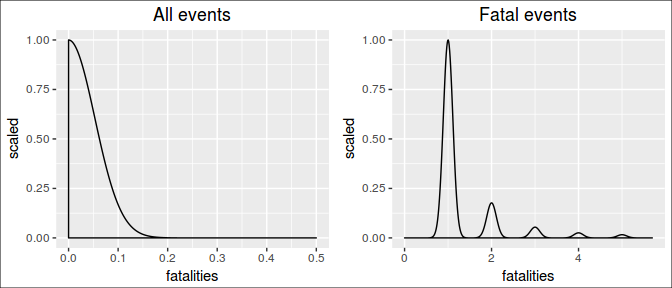
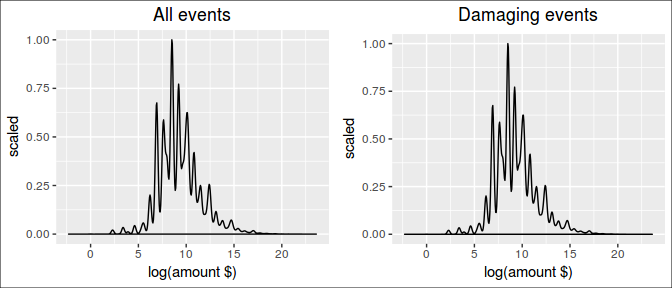
In order to determine what were the most fatal events in a single occurrence, we need to see how fatalities are distributed along the occurrences.
Looking at this distribution, we can infer that the vast majority of those occurrences were not fatal at all: 99.3% occurrences didn’t caused any fatalities.
On the other hand, fatal occurrences had to have at least 1 fatality.
Now, among the fatal occurrences, we are interested in the ones whose fatalities are beyond the confidence interval, ie. above 99% of the most common values.
Looking at this distribution, we can infer that 99.8% of the fatal occurrences caused up to 56.963 fattalities.
Population distribution for fatalities / occurrences
In this study, we looked on the 1% deadliest occurrences.
| rank | event | day | state | county | fatalities |
|---|---|---|---|---|---|
| 1 | hurricane | 2005-08-28 | louisiana | orleans | 638 |
| 2 | tornado | 2011-05-22 | missouri | jasper | 161 |
| 3 | hurricane | 2005-08-28 | louisiana | lower.st.bernard | 140 |
| 4 | tornado | 1953-06-08 | michigan | genesee | 116 |
| 5 | tornado | 1953-05-11 | texas | mclennan | 114 |
| 6 | hurricane | 2005-08-28 | mississippi | harrison | 97 |
| 7 | heat | 1999-07-28 | illinois | cook | 93 |
| 8 | tornado | 1953-06-09 | massachusetts | worcester | 90 |
| 9 | tornado | 1955-05-25 | kansas | cowley | 75 |
| 10 | heat | 1999-07-04 | pennsylvania | philadelphia | 58 |
| 11 | tornado | 1966-03-03 | mississippi | hinds | 57 |
Worst fatal occurrences
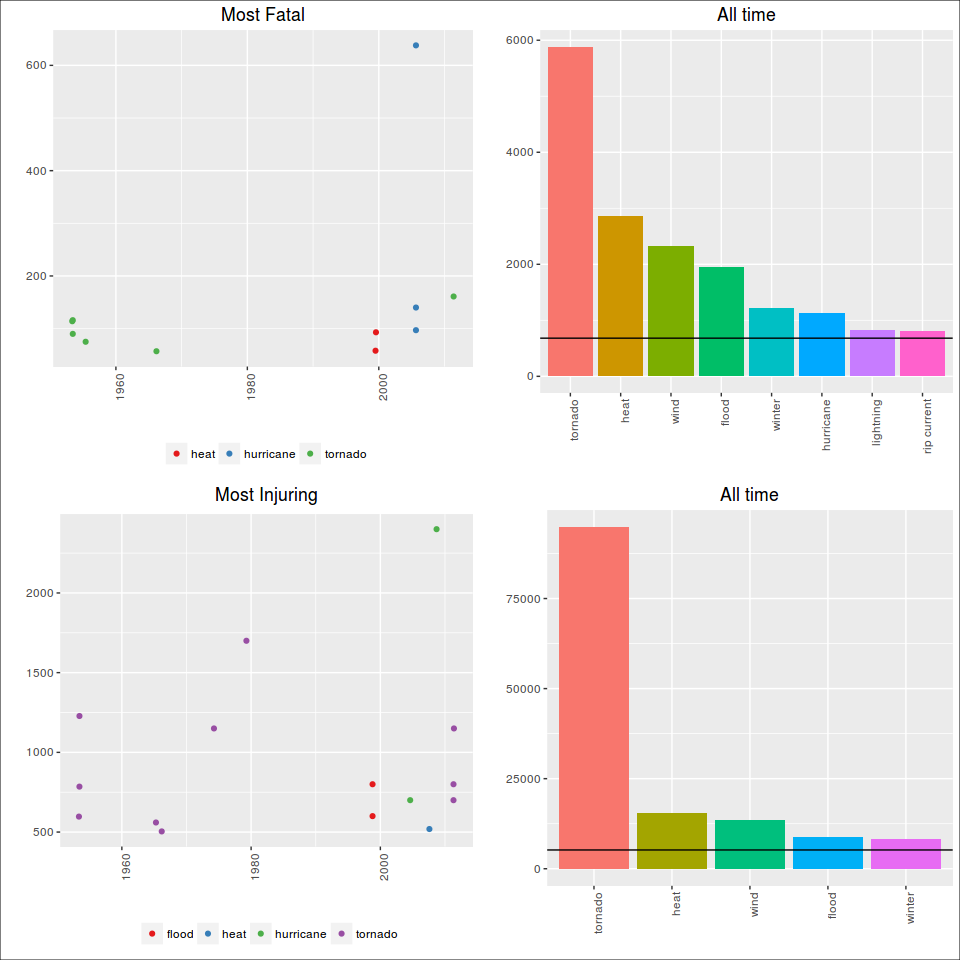
The single most fatal event was a hurricane, that occurred in louisiana, orleans, on 2005-08-28, killing 638 people.
However, if we compare this single awful event to the mean of fatalities caused, we see that this is very unlikely to happen.
Most fatal in all time
Most fatal in all time
Notice that are several occurrences of the same type of event along the time.
Therefore, in order to know which is the worst type of event along all the years, we summed up the fatalities caused by each one of occurrences of this events.
Notice that we are interested only in the worst of them, ie, the ones which are above the mean.
| rank | event | total |
|---|---|---|
| 1 | tornado | 5887 |
| 2 | heat | 2855 |
| 3 | wind | 2325 |
| 4 | flood | 1959 |
| 5 | winter | 1211 |
| 6 | hurricane | 1128 |
| 7 | lightning | 834 |
| 8 | rip current | 806 |
Total fatalities by event
The most fatal event along the time is the tornado. It has killed 5887 people until now.
Least fatal events
Just for curiosity, these are the less fatal among the fatal events:
| rank | event | total |
|---|---|---|
| 28 | tropical depression | 1 |
| 27 | dense smoke | 2 |
| 26 | sleet | 2 |
| 25 | waterspout | 2 |
| 24 | cold | 4 |
| 23 | dust devil | 4 |
| 22 | slide | 4 |
| 21 | sneakerwave | 15 |
| 20 | hail | 21 |
| 19 | tide | 22 |
Injuring Occurrences
Most injuring in a single occurrence
Most injuring in a single occurrence
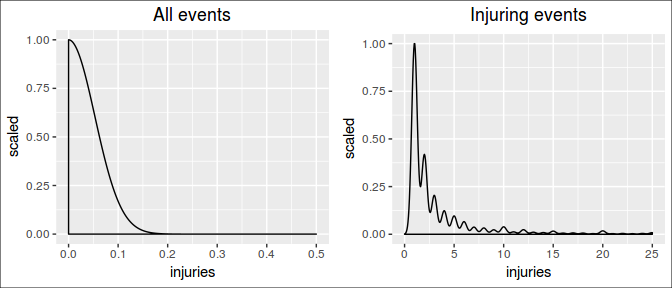
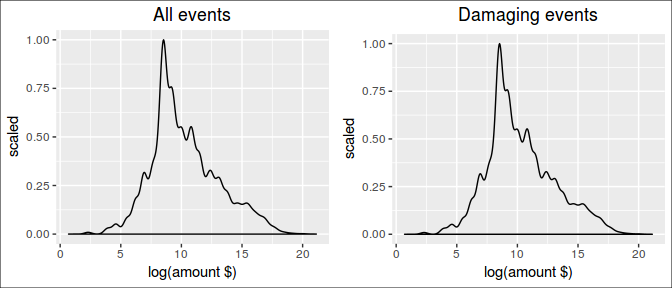
In order to determine what were the most injuring events in a single occurrence, we need to see how injuries are distributed along the occurrences.
Looking at this distribution, we can infer that the vast majority of those occurrences were not injuring at all: 98.5% occurrences didn’t caused any injuries
On the other hand, injuring occurrences had to have at least 1 injury.
Now, among the injuring occurrences, we are interested in the ones whose harm is beyond the confidence interval, ie. above 99% of the most common values.
Looking at this distribution, we can infer that 99.8% of the injuring occurrences caused up to 500 injuries.
Population distribution for Injuries / occurrences
In this study, we looked on the 1% most injuring occurrences.
| rank | event | day | state | county | injuries |
|---|---|---|---|---|---|
| 1 | hurricane | 2008-09-12 | texas | harris | 2400 |
| 2 | tornado | 1979-04-10 | texas | wichita | 1700 |
| 3 | tornado | 1953-06-09 | massachusetts | worcester | 1228 |
| 4 | tornado | 1974-04-03 | ohio | greene | 1150 |
| 5 | tornado | 2011-05-22 | missouri | jasper | 1150 |
| 6 | flood | 1998-10-17 | texas | comal | 800 |
| 7 | tornado | 2011-04-27 | alabama | tuscaloosa | 800 |
| 8 | tornado | 1953-06-08 | michigan | genesee | 785 |
| 9 | hurricane | 2004-08-13 | florida | charlotte | 700 |
| 10 | tornado | 2011-04-27 | alabama | jefferson | 700 |
| 11 | flood | 1998-10-17 | texas | bexar | 600 |
| 12 | tornado | 1953-05-11 | texas | mclennan | 597 |
| 13 | tornado | 1965-04-11 | indiana | howard | 560 |
| 14 | heat | 2007-08-04 | missouri | st.louis | 519 |
| 15 | tornado | 1966-03-03 | mississippi | hinds | 504 |
Worst injuring occurrences
The single most injuring event was a hurricane, that occurred in texas, harris, on 2008-09-12, injuring 2400 people.
However, if we compare this single awful event to the mean of injuries caused, we see that this is very unlikely to happen.
Most injuring in all time
Notice that are several occurrences of the same type of event along the time.
Therefore, in order to know which is the worst type of event along all the years, we summed up the injuries caused by each one of occurrences of this events.
Notice that we are interested only in the worst of them, ie, the ones which are above the mean.
| rank | event | total |
|---|---|---|
| 1 | tornado | 94815 |
| 2 | heat | 15436 |
| 3 | wind | 13518 |
| 4 | flood | 8809 |
| 5 | winter | 8251 |
The most injuring event along the time is the tornado. It has injuried 94815 people until now.
Total Injuries by event
Least injuring events
Just for curiosity, lets show now what are the less injuring among the injuring events:
| rank | event | total |
|---|---|---|
| 31 | funnel | 3 |
| 30 | tropical depression | 3 |
| 29 | waterspout | 3 |
| 28 | other | 4 |
| 27 | drought | 8 |
| 26 | sleet | 10 |
| 25 | sneakerwave | 12 |
| 24 | slide | 13 |
| 23 | cold | 15 |
| 22 | dense smoke | 17 |
Economy: the the most harmfull events
We have determined what events did more harm to economy, both in terms of property and crops damage.
There were events that causes zero property damage but a lot of crop damage. The inverse is also true, so we did a separate analysis to property VS crop damaging events.
Property losses
Most Property Damaging event in a single occurrence
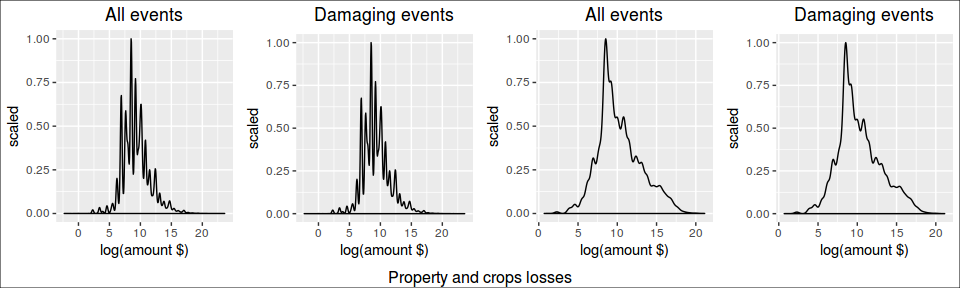
In order to determine what were the most property damaging events in a single occurrence, we need to see how damages are distributed along the occurrences.
Looking at this distribution, we can infer that 99.8% of the occurrences caused less than $38,000,000 in losses.
On the other hand, damaging occurrences had to have damages above zero.
Now, among the damaging occurrences, we are interested in the ones whose damages are above 99.8% of the most common values.
Looking at this distribution, we can infer that 99.8% of the damaging occurrences caused up to $125,282,000 in losses.
Population distribution for losses / occurrences
In this study, we looked on the 1% most harmful occurrences.
| rank | event | day | state | county | value |
|---|---|---|---|---|---|
| 1 | tide | 2005-08-29 | louisiana | orleans | $17,900,000,000 |
| 2 | hurricane | 2005-10-24 | florida | .palm.beach | $10,000,000,000 |
| 3 | flood | 2012-10-29 | new.jersey | eastern.ocean | $7,500,000,000 |
| 4 | tide | 2005-08-29 | mississippi | harrison | $5,630,000,000 |
| 5 | storm | 2001-06-05 | texas | harris | $5,030,000,000 |
| 6 | flood | 2012-10-28 | new.jersey | eastern.monmouth | $5,000,000,000 |
| 7 | flood | 2012-10-28 | new.jersey | western.monmouth | $5,000,000,000 |
| 8 | hurricane | 2004-09-13 | florida | .escambia | $4,000,000,000 |
| 9 | tide | 2008-09-12 | texas | galveston | $4,000,000,000 |
| 10 | hurricane | 2005-08-28 | louisiana | orleans | $3,560,000,000 |
| 11 | tide | 2005-08-29 | mississippi | hancock | $3,380,000,000 |
| 12 | tide | 2005-08-29 | louisiana | st.tammany | $3,030,000,000 |
| 13 | tide | 2005-08-29 | louisiana | lower.plaquemines | $3,030,000,000 |
| 14 | tide | 2005-08-29 | louisiana | lower.st.bernard | $3,020,000,000 |
| 15 | tide | 2005-08-29 | louisiana | upper.st.bernard | $3,020,000,000 |
| 16 | flood | 1997-04-18 | north.dakota | grand.forks | $3,000,000,000 |
| 17 | hurricane | 1999-09-15 | north.carolina | alamance | $3,000,000,000 |
| 18 | hurricane | 2004-08-13 | florida | charlotte | $3,000,000,000 |
| 19 | tide | 2008-09-12 | texas | harris | $3,000,000,000 |
| 20 | hurricane | 2005-08-28 | mississippi | harrison | $2,940,000,000 |
Worst property damaging occurrences
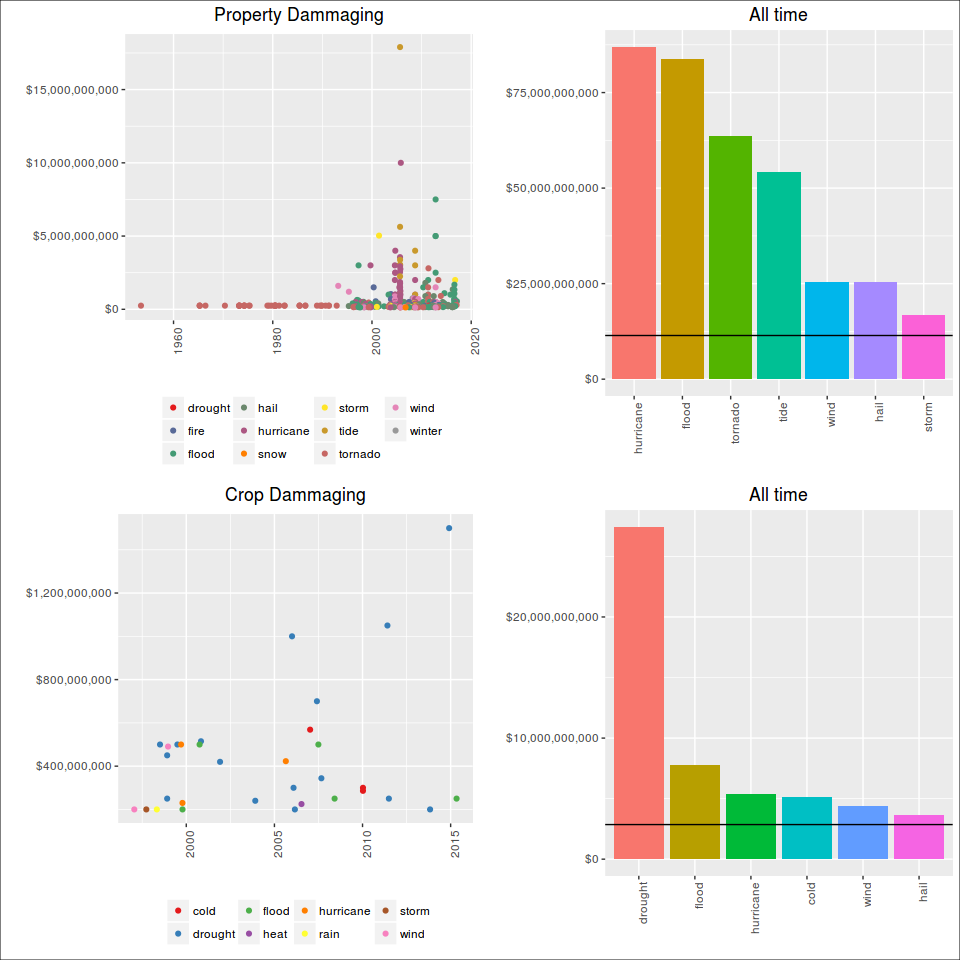
The single most economic damaging event to properties was a tide, that occurred in louisiana, orleans, on 2005-08-29, causing U$ $17,900,000,000 in losses.
Most Property Damaging event in all time
Notice that are several occurrences of the same type of event along the time.
Therefore, in order to know which is the worst type of event along all the years, we summed up the losses caused by each one of occurrences of this events.
Notice that we are interested only in the worst of them, ie, the ones which are above the mean.
| rank | event | total |
|---|---|---|
| 1 | hurricane | $87,005,170,310 |
| 2 | flood | $83,736,516,680 |
| 3 | tornado | $63,741,926,192 |
| 4 | tide | $54,155,102,600 |
| 5 | wind | $25,476,530,618 |
| 6 | hail | $25,402,474,594 |
| 7 | storm | $16,754,690,360 |
Total Property Damages by event
The most property damaging event along the time is the hurricane. It has caused $87,005,170,310 in losses.
Least property damaging events
Just for curiosity, these are the less damaging events:
| rank | event | total |
|---|---|---|
| 33 | other | $1,000 |
| 32 | sneakerwave | $100,000 |
| 31 | funnel | $123,100 |
| 30 | dense smoke | $130,000 |
| 29 | rip current | $163,000 |
| 28 | volcanic ash | $500,000 |
| 27 | dust devil | $1,177,430 |
| 26 | seiche | $1,402,000 |
| 25 | sleet | $3,084,000 |
| 24 | avalanche | $4,060,050 |
| e |
Crop losses
Most Crop Damaging event in a single occurrence
In order to determine what were the most crop damaging events in a single occurrence, we need to see how damages are distributed along the occurrences.
On the other hand, damaging occurrences had to have damages above zero.
Now, among the damaging occurrences, we are interested in the ones whose damages are above 99% of the most common values.
Looking at this distribution, we can infer that 99.8% of the damaging occurrences caused up to $196,735,000 in losses.
Population distribution for losses / occurrences
In this study, we looked on the 1% most harmful occurrences.
| rank | event | day | state | county | value |
|---|---|---|---|---|---|
| 1 | drought | 2014-12-01 | california | northernsanjoaquin | $1,500,000,000 |
| 2 | drought | 2011-06-01 | texas | lubbock | $1,050,000,000 |
| 3 | drought | 2006-01-01 | texas | montague | $1,000,000,000 |
| 4 | drought | 2007-06-01 | mississippi | warren | $700,000,000 |
| 5 | cold | 2007-01-11 | california | sesj | $568,600,000 |
| 6 | drought | 2000-11-01 | texas | parmer | $515,000,000 |
| 7 | drought | 1998-07-06 | oklahoma | choctaw | $500,000,000 |
| 8 | drought | 1999-07-01 | pennsylvania | potter | $500,000,000 |
| 9 | hurricane | 1999-09-15 | north.carolina | alamance | $500,000,000 |
| 10 | flood | 2000-10-03 | florida | .dade | $500,000,000 |
| 11 | flood | 2007-07-01 | missouri | henry | $500,000,000 |
| 12 | wind | 1998-12-20 | california | southernsanjoaquin | $490,500,000 |
| 13 | drought | 1998-12-01 | texas | yoakum | $450,000,000 |
| 14 | hurricane | 2005-08-25 | florida | .dade | $423,000,000 |
| 15 | drought | 2001-12-01 | texas | parmer | $420,000,000 |
| 16 | drought | 2007-09-01 | georgia | baldwin | $344,000,000 |
| 17 | drought | 2006-02-01 | texas | fannin | $300,000,000 |
| 18 | cold | 2010-01-10 | florida | inlandcollier | $300,000,000 |
| 19 | cold | 2010-01-10 | florida | inland.miami.dade | $286,000,000 |
| 20 | drought | 1998-12-01 | texas | andrews | $250,000,000 |
Worst crops damaging occurrences
The single most economic damaging event to crops was a drought, that occurred in california, northernsanjoaquin, on 2014-12-01, causing U$ $1,500,000,000 in losses.
Most Crop Damaging event in all time
Notice that are several occurrences of the same type of event along the time.
Therefore, in order to know which is the worst type of event along all the years, we summed up the losses caused by each one of occurrences of this events.
Notice that we are interested only in the worst of them, ie, the ones which are above the mean.
| rank | event | total |
|---|---|---|
| 1 | drought | $27,454,862,620 |
| 2 | flood | $7,750,266,270 |
| 3 | hurricane | $5,341,874,800 |
| 4 | cold | $5,123,993,200 |
| 5 | wind | $4,429,685,250 |
| 6 | hail | $3,657,850,413 |
Total Crop Damages by event
The most crop damaging event along the time is the drought. It has caused $27,454,862,620 in losses.
Least crops damaging events
Just for curiosity, lets show now what are the less damaging among the events:
| rank | event | total |
|---|---|---|
| 20 | slide | $17,000 |
| 19 | tsunami | $20,000 |
| 18 | tide | $955,000 |
| 17 | surf | $1,000,000 |
| 16 | blizzard | $7,060,000 |
| 15 | lightning | $7,422,670 |
| 14 | debris flow | $20,006,500 |
| 13 | winter | $46,924,000 |
| 12 | snow | $91,145,900 |
| 11 | fire | $448,468,860 |
Most aflicted locations
We have determined what locations had the worst outcome from those events, both in terms of human health and economic losses.
Unfortunately, these has been the worst counties for living in:
Worst fatality count
| rank | state | county | fatalities | injuries | prop.dmg | crop.dmg |
|---|---|---|---|---|---|---|
| 1 | louisiana | orleans | 649 | 132 | $21,614,049,550 | $0 |
| 2 | illinois | cook | 565 | 912 | $670,237,350 | $0 |
| 3 | pennsylvania | philadelphia | 387 | 455 | $52,680,980 | $0 |
| 4 | nevada | lasvegas | 264 | 601 | $14,762,000 | $0 |
| 5 | texas | harris | 216 | 2827 | $10,891,093,870 | $7,450,000 |
| 6 | missouri | jasper | 178 | 1273 | $2,864,881,330 | $46,475,500 |
| 7 | texas | dallas | 149 | 1757 | $1,946,641,730 | $1,405,000 |
| 8 | louisiana | lower.st.bernard | 140 | 0 | $4,845,022,000 | $0 |
| 9 | texas | mclennan | 127 | 657 | $65,192,600 | $1,710,500 |
| 10 | michigan | genesee | 123 | 962 | $132,151,750 | $6,300,000 |
The county with the biggest fatality count is orleans, in louisiana, with 649 people killed.
Worst injuries count
| rank | state | county | fatalities | injuries | prop.dmg | crop.dmg |
|---|---|---|---|---|---|---|
| 1 | missouri | st.louis | 65 | 3144 | $1,461,882,880 | $10,500 |
| 2 | texas | harris | 216 | 2827 | $10,891,093,870 | $7,450,000 |
| 3 | missouri | st.louis. | 118 | 2701 | $79,552,000 | $5,000 |
| 4 | texas | wichita | 55 | 1853 | $310,822,880 | $0 |
| 5 | texas | dallas | 149 | 1757 | $1,946,641,730 | $1,405,000 |
| 6 | alabama | jefferson | 117 | 1700 | $2,037,082,100 | $3,355,000 |
| 7 | massachusetts | worcester | 96 | 1292 | $286,072,530 | $0 |
| 8 | ohio | greene | 40 | 1278 | $289,980,757 | $540,000 |
| 9 | missouri | jasper | 178 | 1273 | $2,864,881,330 | $46,475,500 |
| 10 | oklahoma | oklahoma | 79 | 1253 | $1,356,150,290 | $8,330,000 |
The county with the biggest injuries count is st.louis, in missouri, with 3144 people injuried.
Worst property losses
| rank | state | county | fatalities | injuries | prop.dmg | crop.dmg |
|---|---|---|---|---|---|---|
| 1 | louisiana | orleans | 649 | 132 | $21,614,049,550 | $0 |
| 2 | texas | harris | 216 | 2827 | $10,891,093,870 | $7,450,000 |
| 3 | florida | .palm.beach | 5 | 7 | $10,828,630,000 | $75,000,000 |
| 4 | mississippi | harrison | 110 | 90 | $8,870,659,460 | $0 |
| 5 | new.jersey | eastern.ocean | 16 | 112 | $8,116,441,690 | $10 |
| 6 | new.jersey | eastern.monmouth | 13 | 397 | $6,527,278,550 | $0 |
| 7 | louisiana | st.tammany | 8 | 89 | $5,677,642,950 | $0 |
| 8 | florida | .escambia | 14 | 0 | $5,632,695,000 | $25,300,000 |
| 9 | texas | galveston | 44 | 259 | $5,359,033,770 | $109,602,000 |
| 10 | new.jersey | western.monmouth | 6 | 84 | $5,267,488,450 | $0 |
The county with the biggest property losses is orleans, in louisiana, with $21,614,049,550 in losses.
Worst crops losses
| rank | state | county | fatalities | injuries | prop.dmg | crop.dmg |
|---|---|---|---|---|---|---|
| 1 | texas | lubbock | 37 | 679 | $2,007,426,360 | $2,439,945,000 |
| 2 | texas | montague | 5 | 42 | $118,971,700 | $1,963,106,500 |
| 3 | california | northernsanjoaquin | 14 | 25 | $6,058,500 | $1,520,000,000 |
| 4 | texas | parmer | 1 | 23 | $44,657,090 | $1,181,360,000 |
| 5 | florida | .dade | 10 | 1 | $693,020,000 | $1,168,000,000 |
| 6 | california | sesj | 28 | 64 | $6,167,300 | $992,223,000 |
| 7 | mississippi | warren | 43 | 341 | $314,976,880 | $728,657,000 |
| 8 | california | ecentralsj | 43 | 123 | $7,706,800 | $578,212,000 |
| 9 | california | southernsanjoaquin | 1 | 22 | $18,657,000 | $517,800,000 |
| 10 | north.carolina | alamance | 2 | 8 | $3,005,157,200 | $503,166,000 |
The county with the biggest croperty losses is lubbock, in texas, with $2,439,945,000 in losses.
Results
Population Health
Population Health: fatalities and injuries
The single most fatal event was a hurricane, that occurred in louisiana, orleans, on 2005-08-28, killing 638 people.
The most fatal event along the time is the tornado. It has killed 5887 people until now.
The single most injuring event was a hurricane, that occurred in texas, harris, on 2008-09-12, injuring 2400 people.
The most injuring event along the time is the tornado. It has injuried 94815 people until now.
Economic Damages
Economic Damages: property and crops
The single most economic damaging event to properties was a tide, that occurred in louisiana, orleans, on 2005-08-29, causing U$ $17,900,000,000 in losses.
The most property damaging event along the time is the hurricane. It has caused $87,005,170,310 in losses.
The single most economic damaging event to crops was a drought, that occurred in california, northernsanjoaquin, on 2014-12-01, causing U$ $1,500,000,000 in losses.
The most crop damaging event along the time is the drought. It has caused $27,454,862,620 in losses.
Most aflicted locations
The county with the biggest fatality count is orleans, in louisiana, with 649 people killed.
The county with the biggest injuries count is st.louis, in missouri, with 3144 people injuried.
The county with the biggest property losses is orleans, in louisiana, with $21,614,049,550 in losses.
The county with the biggest croperty losses is lubbock, in texas, with $2,439,945,000 in losses.
Distribution of data